
By Ralph G. O’Brien
Keynote Address for the 14th Annual Kansas State University Conference on Applied Statistics in Agriculture April 2002
Today’s ideal statistical scientist develops and maintains a broad range of technical skills and personal qualities in four domains: (1) numeracy, in mathematics and numerical computing; (2) articulacy and people skills; (3) literacy, in technical writing and in programming; and (4) graphicacy. Yet, many of these components are given short shrift in university statistics programs. Can even the best statistician today really be “completely sufficient”?
We are constantly searching for people who are striving to become Completely Sufficient Statisticians (CSS). What are those?
“… all four types of ability”
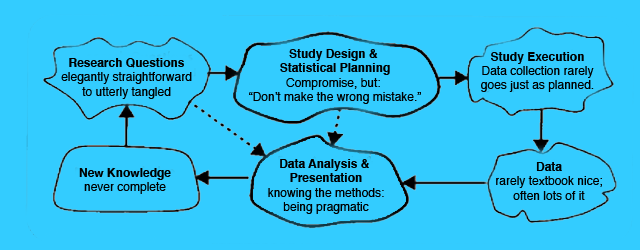
The statistical scientist’s raison d’être is to improve empirical studies conducted by subject matter investigators (Figure 1).

Statisticians are professional experts in the art and science of designing studies, analyzing data, and communicating the results. The research questions range from elegantly straightforward to utterly tangled—to wholly unformed. Whatever the case, we must define a sound study design and plan specific statistical models and tests. No design is perfect, so compromises are required. But as the legendary New York Yankees catcher Yogi Berra said, “Don’t make the wrong mistake.” Textbook data appears from paradise, clean and orderly and complete, but real data often flies in from a Kansas tornado, dirty and disorganized and crippled by missingness. And there is often too much data to possibly be analyzed well, given time and resources. The data analyst has an enormous variety of methods at his disposal. Which ones he uses and how well he uses them is dependent on his talent, creativity, time, and intellectual interest in the problem. Whatever happens, we hope that new useful knowledge is produced. No analysis is complete and more questions will arise to examine another day, if someone has the time. But when things come together, when you help discover something or confirm something that really makes a difference, well, nothing (professionally) could be more satisfying.
In W.G.V. Balchin’s 1976 article in the The American Cartographer, he presented a figure similar to Figure 2 to illustrate that humans evolved by first developing keen visual-spatial skills, then social skills, then verbal skills, and finally numerical skills. “In a brain as highly developed as that of a human being,” Balchin exhorted, “the potential for all four types of ability is inborn, but none of them can come to fruition without education.” This rings true for statistics education: The Completely Sufficient Statistician develops and maintains solid skills in:
- Numeracy
- Articulacy
- Literacy
- Graphicacy

Numeracy
The ideal statistician must be sufficiently mature in using mathematics and numerical computing to define and solve real problems (Figure 3). The mathematical theory of statistics makes firm connections between statistical science and mathematics, which is still stressed in university statistics programs, as it should be. By “numerical computing,” I mean all the methods and skills that enable us to transform raw observations into sound descriptive and inferential statistics. This involves more than the ordinary use of common statistical software systems (e.g., SAS). The CSS must be able to adapt those systems or use a regular programming language (e.g., C) to solve unique problems or carry out computations for methods that are not available in those systems. Our recruiting efforts at the Cleveland Clinic indicate that too many students are not sufficiently skilled in numerical computing.

Are those well trained in mathematical statistics and numerical computing sufficiently numerate? No. Full numeracy requires the CSS to be able to use mathematics and numerical computing on real subject-matter studies that may have diffuse and tangled research questions, imperfect and/or unique designs, and messy data. Too many gifted mathematical statisticians are rather unskilled statistical scientists. They did well in courses like measure theory and may even now teach them, but they flounder when translating a concrete issue in a subject-matter study into a statistical model that can field pragmatic solutions. They flounder again when they must translate their mathematical work back into the concrete terms of the study. This is a failure in numeracy.
In the December 2002 issue of Amstat News, David Moore, Roxy Peck, and Alan Rossman reported on a workshop held in October 2000 at Grinnel College. They wrote:
What Do Statisticians Need from Mathematics?
The two highest priority needs of statistics from the mathematics curriculum are to:
(1) Develop skills and habits of mind for problemsolving and for generalization. Such development is deemed more important than coverage of any specific content area.
(2) Focus on conceptual understanding of key issues of calculus and linear algebra, including function, derivative, integral, approximation, and transformation.
While the Grinnel workshop was concerned with undergraduate training, the same general prescription holds for graduate training. When a university’s statistics faculty is comprised of people who have primary interests in mathematical statistics, this remains the dominating theme of their hiring, their curricula, and their campus-wide service programs (consulting units, if any). When a statistics curriculum overemphasizes mathematical training, it comes at the expense of training in other domains.
All exercises given to students should emanate from something close to reality. Let me illustrate. For several decades, Dr. X (a real person, but not identified here) has been teaching an introductory statistics course in a mathematics department at a top-ranked liberal arts college.
Here, virtually verbatim, is one of his recent homework exercises:
The weight of a chemistry textbook is a normal random variable with a mean 3.5 lbs and standard deviation of 2.2. The weight of an economics textbook is a normal random variable with a mean of 4.6 lbs and a standard deviation of 1.3. Compute:
(a) the probability that the total weight of two books will be 9.0 lbs or more
(b) the probability that the economics book will be heavier than a chemistry book
The problem is trite, has no connection to anything that a real investigator would study, and makes no sense mathematically (because the specified distribution implies that books can have negative weight). It fails completely to build statistical numeracy. In fact, it hurts it.
This reinforces the oft-heard notion that introductory statistics remains one of the worst courses taught in the undergraduate curriculum. Last year, I received the following email from my younger daughter:
Hi. I just wrote to inform you that my stat prof is incredibly bad. He’s a really nice guy and I’m sure he knows what he’s doing, but he really can’t teach. We spent an entire 1.5 hours learning about mean, median, and mode. WHAT IS WRONG WITH STAT TEACHERS!!? Oh well, should be easy at least. Don’t know how much longer I’ll keep going to class … he teaches straight out of the book. The chance of me following in your footsteps is now reaching a probability of .0000000001. 🙂
I am pleased to report that at least for now (Fall 2002), she is majoring in mathematics and psychology and is planning to take as many statistics courses as she can. I hope she will be given problems with more realism, such as:
Suppose that ordinary cows milk contains two forms, gamma and omega, of the (fictitious) coenzyme benumerate. Across individual cows, benumerategamma has a mean concentration 20.0 mg/L with a standard deviation of 4.0mg/L, and benumerate-omega has a mean of 30.0 mg/L and a standard deviation of 6.0 mg/L. The correlation between the two measures is -0.40.
(a) What is the probability that the total benumerate concentration exceeds 40 mg/L in an individual cow’s sample of milk? What did you have to suppose (a better term than “assume”) mathematically in arriving at this answer? Discuss the sensitivity of your answer to what you supposed mathematically. In other words, how likely is it that your mathematical suppositions are so wrong that your results based upon them would be seriously misleading?
(b) What is the probability that the omega form exceeds the gamma form by at least 5 mg/L in an individual cow’s sample of milk? What mathematical suppositions did you make in arriving at this answer? Discuss the sensitivity of your answer to what you supposed mathematically.
The small Milky Way Farm has 25 dairy cows and their milk is pooled.
(c) What is the probability that the total benumerate concentration exceeds 40mg/L in a sample of pooled milk? What mathematical suppositions did you make in arriving at this answer? Discuss the sensitivity of your answer to what you supposed mathematically.
Note that questions (a) and (b) are largely isomorphic to Dr. X’s above, except that I have stated nothing about normality, because such things are never truisms in real problems. We suppose (pretend?) that such “assumptions” hold in order to get our work done, and we need to consider how sensitive our answers might be to “violations” of those assumptions. Question (c) hits the notion that the normality assumption is less important for problems involving means, but it does so in a way that reflects how real problems come presented subtly to the statistician. There are no perfect answers for questions like these, which is just fine for developing statistical numeracy. In applying mathematical abstractions to solve real problems, we need to again heed Yogi Berra’s advice: “Don’t make the wrong mistake.”
Mathematical numeracy is not sufficient for statistical numeracy. The Completely Sufficient Statistician must be insightful and practical in adapting her expertise in mathematics and numerical computing to answer real subject-matter questions.
Articulacy
Balchin put articulacy—speaking and listening—as a social skill. Obviously, this also involves the ability to work effectively with many types of people. Our profession is fairly criticized for having too many members with deficiencies in these areas. Can we build articulacy and people skills in statisticians?
Articulacy. People tell me that I am reasonably articulate; maybe they are only being kind. But supposing I am, how did I learn this?
When my junior high school guidance counselor scheduled my courses for my ninth-grade year, she directed me to take drama for my English elective. It sounded better than taking creative writing or journalism or literature, so I agreed. Our first assignment was to create and deliver a short solo performance in front of the class. Fine. But what would I do?
The previous summer, I had attended a concert by a very popular folk group, The Kingston Trio (“Hang Down Your Head, Tom Dooley”). The ‘warm-up’ act for the show was a young comedian who had just finished appearing at the famous San Francisco “talent discovery” venue, The Hungry Eye. I recalled how terrific this guy was, remembered his name, and discovered he had already released a record album of his routines. I bought it (Still own it!) and found the monologue I had loved seeing performed.
I adapted it to fit my drama class assignment, and rehearsed it silently and secretly in my bedroom. Finally, I gave it at school. People laughed and applauded! I even gave an encore performance to the creative writing class. It was so much fun! I learned I could do this kind of thing, and my new-found confidence only increased from then on. Oh, and lest you wonder, I acknowledged the source of my material before performing it. The routine was called “Noah!” and that unknown rookie comedian was Bill Cosby.
So what’s my point? Successful speakers have good things to say and they adapt their message to fit the audience’s expectations, whether it’s for a single person or a thousand. Even the best speakers rehearse, if only just silently to themselves. Gaining confidence is the key, and you may have to be coerced into this at first. Above all, if you make it fun for yourself, it will be better received.
Too many statisticians have never been forced, or even encouraged, to develop articulacy. When I taught applied multivariate analysis at the University of Tennessee, my course attracted both statistics and nonstatistics graduate students. Most of the project work was presented orally in small seminar sessions of 4-6 students.
The nonstatistics students had already presented several projects in a prior course with me and probably in their subject-matter courses, as well. Most were quite articulate. But for many of the statistics students, this was their first such experience and they struggled at first. Yet, most were improving substantially by the end of the course.
Too often, however, statistics students with the greatest speaking deficiencies are never asked to present orally, especially to nonstatisticians. If they give any talk at all, it is only related to their research in statistics, say for their dissertation orals or for practicing their “job interview talks.” Faculty give little guidance or feedback about the presentation itself. Thus, most CSSs have developed articulacy on their own.
People skills. Most empirical research is carried out by teams of researchers, and the statistician must operate as an effective colleague. As with articulacy, I do not know how to develop good people skills in someone—it may just be some unknowable function of one’s personality—and there are undoubtedly people who think I, myself, need further development in this area! Allow me, however, to share a story that drives home the key point.
A few years ago, I gave a two-day workshop on sample-size analysis at a major university. I already knew one of my former U Virginia psychology graduate students was now a chaired full professor on this campus and that he (let’s call him “Mark”) had several impressive position titles after his name. In fact, Mark’s research funds were helping to sponsor my visit.
He and I had already arranged to have lunch on the second day of my workshop. During the morning break of the first day, a few of Mark’s staff members told me what a great guy he was and how he had this uncanny knack for assembling terrific teams of people. I continued to hear this during other breaks and meals. Lunching with Mark the next day, he and I recalled old times and he caught me up on other former student-friends of mine. As we were saying good-bye, I hit him with the big question I had been saving: “Mark, your staff tells me that you have this amazing ability to hire and retain terrific people for your project teams. How do you do it?” Mark’s reply was quick, crass, and pithy: “I don’t hire a__ h____, no matter how smart they are.”
The quip reverberates in my head whenever I judge an applicant for hiring or promotion. For whatever reason, some statisticians may be fully loaded with technical strengths, yet they cannot work effectively within teams. At times, their behavior may become so disruptive that we are better off without them. They are not Completely Sufficient Statisticians, no matter how technically smart they are.
Literacy
The Completely Sufficient Statistician must be literate in both technical writing and programming, two aspects of our profession that are more similar than most of us appreciate.
Technical writing. Many of us were attracted to statistics because we liked mathematics, science, and computing—all fields based on specific theories and principles. Such courses have relatively light reading loads and do not stress writing. In fact, I tried to avoid humanities courses because they were too ‘subjective,’ had oppressive reading lists, and required so many essays and term papers. Soon enough, however, I came to find that every facet of my chosen profession required me to write clearly. I also discovered that what statisticians write is often onerous to read. This need not be so.
Consider the following two passages. The first is the actual opening text of the first chapter of a recent book on equivalency testing written for professional statisticians. (If you must determine the source, the ISBN is 1-58488-160-7). The second passage is my revision.
(Actual)
It is a basic fact well known to every statistician that in any hypotheses testing problem there is an inherent logical asymmetry concerning the roles played by the two statements (traditionally termed null and alternative hypotheses) between which a decision shall be taken on the basis of the data collected in a suitable trial or experiment: Any valid testing procedure guarantees that the risk of deciding erroneously in favour of the alternative does not exceed some prespecified bound whereas the risk of taking a wrong decision in favour of the null hypothesis can typically be … [too] high …
(Revised)
Every statistician knows that in traditional statistical inference, the null and alternative hypotheses play asymmetric roles. While we take great care to set specific limits on the risk of deciding erroneously in favour of the alternative hypothesis, we fail to properly limit the opposing risk of making a wrong decision in favour of the null.
I tried to make the passages have the same meaning. Does the actual version take more time and effort to understand? On the whole, the book offers us plenty of worthy content, but will its writing style prevent it from having the impact it deserves?
Only the rare statistician possesses a natural gift for writing at a professional level. It is difficult, frustrating, and time-consuming work, even after years of experience. You may have earned high marks in college for penning creative essays, but writing technical material is fundamentally different.
Fortunately, there is a science to technical writing based on a set of principles. I discussed this briefly in an article that appeared in the September 2002 issue of Amstat News. Better yet, read George Gopen and Judith Swan’s seminal article, “The Science of Scientific Writing” (1990). They argue that complex technical matter should not lead to impenetrable writing. Technical writers must understand how readers read, and they must write with the reader’s perspective in mind.
You can learn to write well. After studying the Gopen-Swan article, treat yourself to William Strunk and E. B. White’s The Elements of Style (1999). This timeless classic captures the essence of clear writing, but it lacks detail and exercises. Joseph Williams’ Style: Ten Lessons in Clarity and Grace (1999) covers the same principles as the Gopen-Swan article and The Elements of Style and also provides the necessary instructional depth and exercises to enable you to master these skills. Last summer, I had fun guiding 30 Cleveland Clinic biostatisticians through Williams’ book. (They all volunteered.)
For a handy reference tool, see Handbook of Technical Writing (2000) by Gerald J. Alred, Charles T. Brusaw, and Walter E. Oliu. It contains more than 700 pages of detail on grammar and punctuation, etc. Unfortunately, it devotes only two pages to mathematical material.
For additional writing tips download the PDF “Discover the Science of Technical Writing.”
Do you want material more specific to mathematics and statistics? At long last, the American Mathematical Society has updated Ellen Swanson’s Mathematics into Type (1999). It is excellent and modern, even discussing TEX and LATEX. A chapter titled “Mathematics in Type” appears in the Chicago Manual of Style (1993), which the American Statistical Association recommends to authors preparing papers for its journals. Biostatisticians especially will profit from consulting Tom Lang and Michelle Secic’s How to Report Statistics in Medicine (1997), which Nadine Martin praised in her March 1998 review in the Journal of the American Statistical Association.
Most of what we write is ‘published’ only by us printing it from our computer or creating a web page. Thus, today’s most skillful writers must learn how to do their own page layout work—choosing the fonts, setting the page styles, and positioning the tables and figures. Here, too, there are principles to guide us. Robin Williams (not the actor) and her various coauthors cover the basics in several wonderful books and articles.
Just as one must gain confidence in speaking, so must one gain confidence in technical writing. My personal breakthrough came just after thoroughly studying the first edition of Joseph Williams’ book (see above). I had analyzed some data collected by a chaired professor of both English and law, who was studying how various kinds of written warnings on packages (e.g., cigarettes) are interpreted by people. She drafted the methods and results sections of her manuscript and asked me for my comments. Because I found the writing unsuited to a scientific article, I rewrote the relevant sections and sent them back. She called me soon to say she loved my version. That was a huge confidence builder. If I could successfully rewrite the prose of an accomplished English professor, I had “arrived” as a competent technical writer. I often tell people that writing was the hardest thing I ever had to learn. I still struggle with it and always will.
Programming literacy. For the Completely Sufficient Statistician, literacy extends to writing computer code in a style that makes it easier for anyone to decipher, debug, and modify a program, which also makes it more stable and efficient. I was introduced to this concept in graduate school when an extraordinary professional programmer in the psychometric lab happened to scan my abstruse Fortran code. He immediately suggested I read Brian Kernighan and P. J. Plauger’s The Elements of Programming Style (last revised in 1978, now no longer in print). The title’s similarity to that of Strunk and White’s classic, The Elements of Style, was no coincidence. Kernighan and Plauger showed how Strunk and White’s principles of clarity and simplicity could be adapted to programming. These lessons live on in Kernighan and Rob Pike’s The Practice of Programming (1999).
Consider the following representative fragment of code that I extracted from a much larger SAS datastep program.

The statisticians for this legacy project had departed and I needed to make modest changes to some of their programs to finish analyses for a manuscript they started years earlier. What is f01q15, and what do values of “2” and “3” denote? What is the index being created?
Even though I knew that f01q15 stands for “Form #01, Question #15,” I still had to consult the archive of the data forms to discover that this is an item called “Ascertainment,” which records the prime reason why the subject was screened for alpha 1-antitrypsin deficiency, a rare genetic pulmonary disease. There were nine legitimate values: 1, 2, …, 9. “2” indicates the patient had suspicious pulmonary symptoms and “3” indicates the subject was related by blood to a known alpha 1patient. Thus, the code fragment above reduces the nine categories of f01q15 to three making up index.
This code may run without producing errors, but it exemplifies programming illiteracy. Note as well that if f01q15 contains an illegitimate or missing value, index will become “3,” just as if it is a legitimate Ascertainment value other than “2” or “3.” Programming illiteracy is often related to programming errors and instability.
My task would have been far easier if the code read like the following.

Of course, there are many factors that determine programming quality and many good styles. Although working statisticians spend much of their time programming, few statistics students are taught sound programming style. The Completely Sufficient Statistician must become programming literate on her own. The recent book by Kernighan and Pike is a great place to start.
Graphicacy
Articulacy and literacy involve serial communication: Words, numbers, and terms in formulas are sent and received in sequence and the brain gathers them into short-term memory and clusters them into phrases, then sentences, etc. to build ever more complex ideas. Graphicacy involves parallel communication: All of the information is delivered at once, usually via a static two-dimensional image, which the human brain has an amazing ability to process. More advanced graphics use dynamic (moving) images that may also be virtually three-dimensional.
Graphics allow humans to comprehend information that would be inefficient, if not impossible, to communicate using words, numbers, and formulas alone. Modern computers and software now allow even those of us with virtually no drawing skills to make rich (and poor) graphics, and today’s educated person, regardless of discipline, must seek ever higher levels of graphicacy. The CSS must be able to design and produce good statistical graphics.
By almost any standard, one of the most influential books ever published in statistics is Edward Tufte’s The Visual Display of Quantitative Information (2001). Tufte’s writings teach us many things, but none more important than understanding that a complex statistical graphic can still be understood as long as both the creator of the graph and its viewer have sufficient graphicacy and give the necessary time and effort.

In Part II of Visual Display, Tufte advances a theory of data graphics, which is something any CSS should consider taking to heart and practicing. He exhorts us to “show the data” and “maximize the data-ink ratio.” His examples show a clarity and simplicity in statistical graphics that is isomorphic to the teachings of Strunk and White in writing and Kernighan and colleagues in programming style. Those interested in more on this should also study the books and articles by William S. Cleveland, Howard Wainer, and Michael Friendly.
To give these ideas some substance, consider the graphic in Figure 5, which is modeled directly after one that appeared in 2000 in a prestigious medical journal that is noted for having thorough statistical reviews of its published papers. The figure description mimics the original, as well. Note that no data are shown, only three means and three standard deviations, providing an extremely low data-ink ratio. Ironically, figures like this are sometimes called “detonator plots.” As the name suggests, graphics like this should be blown into smithereens.

Now consider Figure 6. This graphic shows all 48 observations and still displays the group means. It also shows the p-values for the significance tests. Most investigators have no trouble understanding this kind of figure and they see immediately how it is superior to detonator plots.

Finally, consider Figure 7, which plots data obtained from a study by Cerda, et. al. (1988). This graphic is complex and novel, but I have never found an investigator who could not understand it, as long as they understood AB/BA crossover designs and were sufficiently motivated to learn about a new kind of graphic. The 27 patients in this study had chronically high serum levels of LDL (“bad”) cholesterol. Half of them (randomly assigned) were treated “AB,” that is they got placebo (“A”) first, followed by pectin (“B”), with a wash-out period intervening. The remainder got the opposite order (“BA”). One can see that they experienced mean reductions in LDLC during both the placebo and pectin phases. However, their reductions with pectin were larger, as can be seen on the diagonal tick plot of the differences between the LDLC reduction under pectin and under placebo.

I tried to make this plot conform as much as I could to Tufte’s edicts, as described graphically (of course) in Figure 8. When I knowingly violated something, I did so for what I thought was a good reason.

Statistical graphicacy will continue to grow in importance because there are many features of data and many results from data analyses that can hardly be understood any other way. Modern society throws all kinds of graphics at us every day, and this can only raise general levels of graphicacy. Statisticians must learn how to make effective graphics and they must convince investigators to use those that are far richer than the usual “visual bites” (à la “sound bites”) they are used to, like detonator plots.
Struggling for Complete Sufficiency
Can complete sufficiency be realized? Rarely. It is quite ideal. But struggling to reach some ideal is often worth the effort. Should statistics faculty and students struggle with this?
Suppose Investinpeople University stops charging traditional tuition. Instead, for the rest of their lives, students will pay back 0.5% of their gross income to IU for every full-time equivalent semester they attend. This ought to motivate the faculty to produce graduates who will have skills that will “pay off ” in the long run. What should the IU Statistics Department stress in their BA, MStat, and PhD programs?
Tabled below are the various domains discussed above, along with A-F letter evaluations on the current MStat program at IU and two sets of weights on how important each domain is. The first set of weights corresponds to a “traditional” MStat program; the second corresponds to producing the Completely Sufficient Statistician. The letter grades and weights yield overall grade point averages (GPA) on the usual A = 4.0 scale.
Under the current weights, the MStat program at IU is quite respectable, GPA = 3.3, roughly A-. But viewed from the CSS standpoint, it is only GPA = 2.7, or C-. Typical IU graduates will need considerably more training when they actually go to work as Real Statisticians—if they can land a position that will provide that training.
We do this at the Cleveland Clinic and it is a huge expense in delayed productivity and direct training costs. Organizations finding Completely Sufficient Statisticians will offer them greater starting salaries and faster promotions.

If IU’s statistics faculty wants to increase the value of their investment in their students, they will improve their curriculum to better meet the goal grades in the table. This may lead to some lessening of the traditional mathematics emphasis in order to find time to teach other essential skills, but the overall GPA of 3.4 (versus 2.7 before) will be worth the change. For example, IU’s course on classical large sample theory might have to be dropped as a required course and other courses might have to restructured somewhat to better stress solving real problems, communicating orally and in writing, producing literate programming code, and developing excellent “Show the Data” graphics. Only the rare student might surpass CSS standards in all areas, but all should certainly be expected and supported to try.
How well would you do if you scored your own statistics programs, your own work unit, or your own set of skills?
Like you, my opinions stem from my experiences, so let me tell you a bit about myself. I’ll bet that my formal training in statistics was quite different from yours, and that I’ve wandered more than usual over my 27-year career path. This has allowed me to see our profession from various perspectives.
As an undergraduate mathematics major at Claremont McKenna College (CMC) in California, I was introduced to statistics by Professor Janet Myhre. For one class assignment, Dr. Myhre had us (unofficially) review a manuscript submitted to Technometrics. Not bad for being mere undergraduates, eh? I went immediately to graduate school in operations research at The University of North Carolina at Chapel Hill, earning my MS degree.
People are usually surprised to learn that my PhD from UNC was from the L. L. Thurstone Psychometric Lab. Like many key events in one’s life, my becoming a “lab student” happened by accident, but it was no accident that I used the opportunity to take statistics courses in three very different graduate programs: statistics, biostatistics, and psychometrics. In addition, I was required to take several courses in the science of psychology. I gleaned a precious “statistical gestalt” from all this heterogeneity.
With my doctorate in hand in 1975, I joined the psychology faculty at the University of Virginia. As I increasingly became a mainstream academic statistician with broad subject-matter interests, I realized I needed to find a home in a real statistics department, which UVA did not have. Accordingly, in 1982, I joined the statistics department at the University of Tennessee, Knoxville. Still experiencing some wanderlust, my interests then moved toward biomedicine, but UTK has no major health sciences center. So, in 1989, I joined the division of biostatistics in the department of statistics at the University of Florida. In 1994, I left regular academia to join the department of biostatistics and epidemiology at the Cleveland Clinic Foundation.
I direct the Department of Biostatistics’ Collaborative Biostatistics Center (CBC), a group of about 40 professionals making up six teams that consult and collaborate with Cleveland Clinic researchers on more than 600 projects annually. The bulk of the CBC’s project effort and functional leadership comes from MS-level biostatisticians who work directly and independently with physician scientists. CBC biostatisticians earn coauthorships on more than 125 publications per year.
The best thing about directing the CBC is that its members are so skilled and dedicated. The worst thing about the role is finding, recruiting, and retaining such people. We are constantly searching for people who are striving to become Completely Sufficient Statisticians (CSS).

I think this segment does a great job of lightly dipping into the importance of statistics. As an undergraduate biomedical engineering student, I wish I would have had a better class in statistics. Part of the responsibility of an engineer is to accurately and clearly communicate results to the general public and other specialists (scientists, doctors, etc.). If I were to improperly interpret data, it could result in research that may physically harm people, considering my field. On the flip side, if I accurately analyze the data using statistics but cannot communicate it well, the community may miss out on some critical information (like a new drug) simply because I did not explain it well.
Update. It was my daughter, Katie M. O’Brien, who wrote “The chance of me following in your footsteps is now reaching a probability of .0000000001.” Ironically, she would go on to earn a PhD in Epidemiology from the University of North Carolina. Her dissertation focused on using Bayesian methods in studies of breast cancer genetics. At Katie’s sincere invitation, her mother and I attended the public portion of her final oral PhD exam (the formal presentation of her dissertation), but Katie sternly forbid me from asking any questions.
Good morninng,
You are cited in
https://www.psychologie.hhu.de/fileadmin/redaktion/Fakultaeten/Mathematisch-Naturwissenschaftliche_Fakultaet/Psychologie/AAP/gpower/GPowerManual.pdf
O’Brien, R. (2002). Sample size analysis in study planning(using unifypow.sas).(availableontheWWW:http://www.bio.ri.ccf.org/UnifyPow.all/UnifyPowNotes020811.
So far in vain I tried to get this source. Please help me.
Best regards, Detlef Axmann