
Statistics can be a force for good, but what does that look like in practice? For Patrick Ball, it means using statistical methods to document human rights violations, uncover patterns of violence hidden by incomplete data, and provide evidence for international war crimes tribunals.
We spoke with Ball about how he found his way into this work and asked him what advice he has for students who want to use statistics to make a difference.
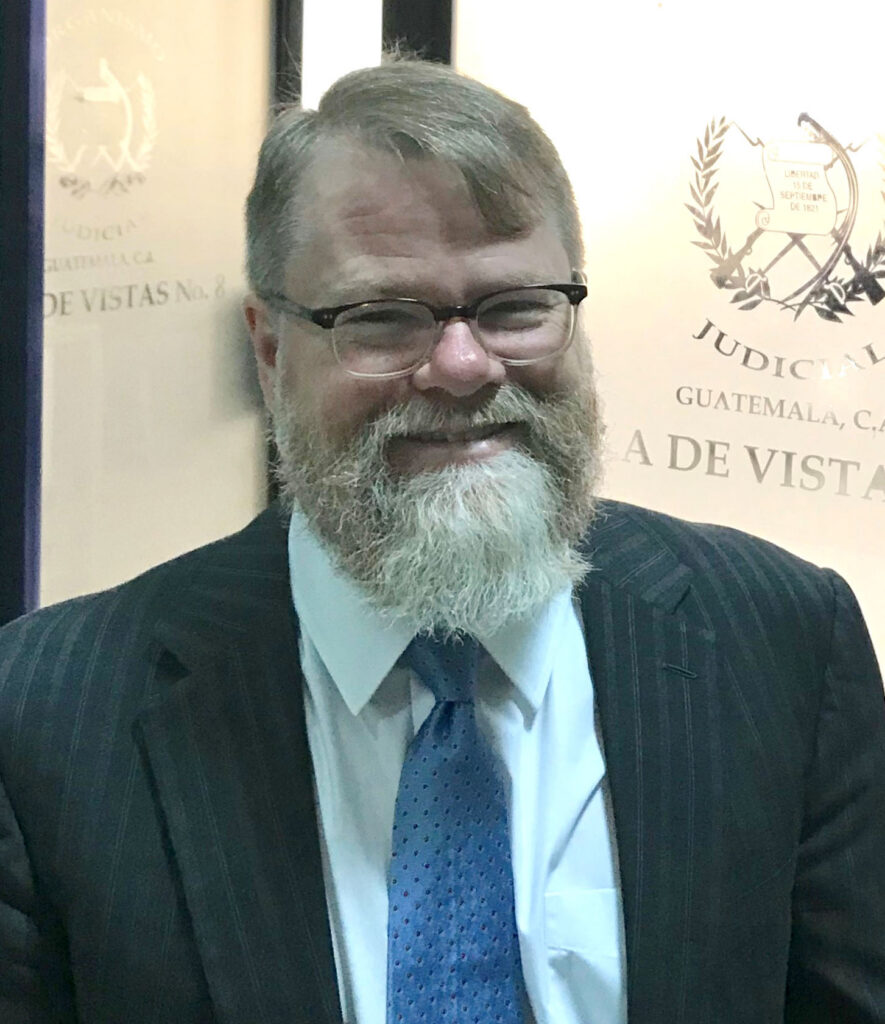
Patrick Ball is the director of research at the Human Rights Data Analysis Group, where he conducts statistical analyses to document patterns of human rights abuses. His findings have been presented as evidence in international tribunals against war criminals such as Serbian and Yugoslav politician Slobodan Milošević and the de facto president of Guatemala, General José Efraín Ríos Montt. An ASA Fellow, Ball was honored with the Nature Awards John Maddox Prize in 2024 and the Karl E. Peace Award in 2018. He earned his BA from Columbia University and his PhD from the University of Michigan.
How did you come to this work? Were human rights always a driving interest, or did you arrive here from an unexpected direction?
In the 1980s, when I was a college student, I was politically active—mostly on the political left. But after traveling to Nicaragua in 1987, I was appalled at what I saw. It forced me to rethink what politics meant and why I wanted to be involved. I realized the answer I was looking for had the name “human rights.” The things I cared about turned out to be written down in the 30 articles of the Universal Declaration of Human Rights.
I later went to El Salvador, where I worked as a database programmer for the Non-Governmental Human Rights Commission while also doing nonviolent accompaniment work. When the war ended, I helped organize 15 years of human rights documentation into a database so we could analyze it. I was impressed with my colleagues’ courage and their commitment to careful documentation, and when I saw the impact statistical analyses could have, I was hooked. I’ve been doing this work ever since.
Can you walk us through a specific case in which your analysis changed what was known or believed about an atrocity?
Most of the statistics-focused projects lead with a population estimate of total homicides. That’s always the headline: How many? Because authorities conceal killings, people are afraid to report them, and many deaths occur in places that are difficult to document, we have to estimate. That’s the work Fritz Scheuren taught me to do.
But what’s usually more interesting is what the analysis reveals beyond the total or estimated count. In Guatemala, for example, we compared the probability of being killed by the army in three counties between March 1982 and August 1983. After controlling for the underlying population, we found Indigenous people were about eight times more likely to be killed than their non-Indigenous neighbors.
That distinction mattered because it directly challenged the claim that the army was simply killing everyone to eliminate communists. The statistics showed people were not being killed at random—they were being targeted because of their membership in a specific ethnic group. Statistics enabled us to make that story clear, even with incomplete data.
What does statistical analysis reveal in human rights investigations that a simple count can’t?
Many violent deaths occur in areas that are logistically inaccessible. For example, if I want to compare the ratio of Indigenous to non-Indigenous people killed by the Guatemalan army in a specific location and time, I need to know how many people in each group were killed. But the non-Indigenous victims may be much easier to document, while I may identify only a fraction of the Indigenous victims.
If I simply counted the cases I could observe, I would simply be describing observability. I’d be analyzing what I can see, trapped in my own project’s limitations. That is absolutely inadequate. I sometimes refer to it as Sesame Street statistics—the naïve idea that all the deaths are on the screen, and we just freeze the image on the screen and count. We know better than that.
In my experience now, with more than 35 years of work in over 30 countries, I’ve found there is almost always a relationship between categories of victims and whether we can document them. Simply collecting more sources doesn’t solve the problem because many sources share the same biases. You have to come up with a statistical estimation procedure that accounts for the missing data.
It’s super important to get this right. When you purport to speak with the voice of the victims, you assume a lot of authority. You’re speaking truth to power, and it better be true. Otherwise, you risk discrediting the people who have suffered. That means using all the science.
If you’re asking, ‘Where should I apply for a job?’ that’s not going to work. You’re going to have to figure out how to engineer the opportunity.
What do you wish more students understood about what statisticians can do outside academia or traditional research settings?
Well, let me start with the wrong way. The wrong way is to go looking for a job. There are no jobs. Most people who need statistics don’t know they need it. If you tell them they should hire a statistician to create good footnotes for you, they’ll just laugh at you and move on.
You have to create the job. And you create the job by figuring out how to raise the funds, how to organize people, how to do the analysis yourself, and get your argument into the debate. Nobody’s going to do it for you. Even today, I see former colleagues relying on Sesame Street statistics. You just have to get in there and do the estimates, explain them, and then you’ll get a start.
If students are thinking about this kind of career, they need to figure out their own path. That doesn’t mean there isn’t a career—there absolutely is. In fact, there are many careers, but they need to be created. If you’re asking, “Where should I apply for a job?” that’s not going to work. You’re going to have to figure out how to engineer the opportunity. I don’t usually like to use this word, but you’re going to have to be an entrepreneur.
Next up in this series, we interview David Corliss, who provides pro bono statistical expertise to charitable and social justice organizations.
Leave a Reply